- Version
- Download 495
- File Size 639.24 KB
- File Count 1
- Create Date October 29, 2020
- Last Updated August 20, 2024
Tel: 480-443-3413
Fax: 480-371-2754
Domestic Toll Free:
800-364-8985 (US/Canada only)
Technical Support:
support@noraxon.com
Tel: 480-443-3413
Domestic Toll Free:
800-364-8985 (US/Canada only)
Fax: 480-371-2754
Technical Support:
support@noraxon.com
Our Products
Our product
Customer Service
Upcoming Events

Tel: 480-443-3413
Domestic Toll Free:
800-364-8985 (US/Canada only)
Fax: 480-371-2754
Technical Support:
support@noraxon.com
Our Products
Customer Service
Upcoming Events
Congress of the International Society of Biomechanics (ISB) Booth
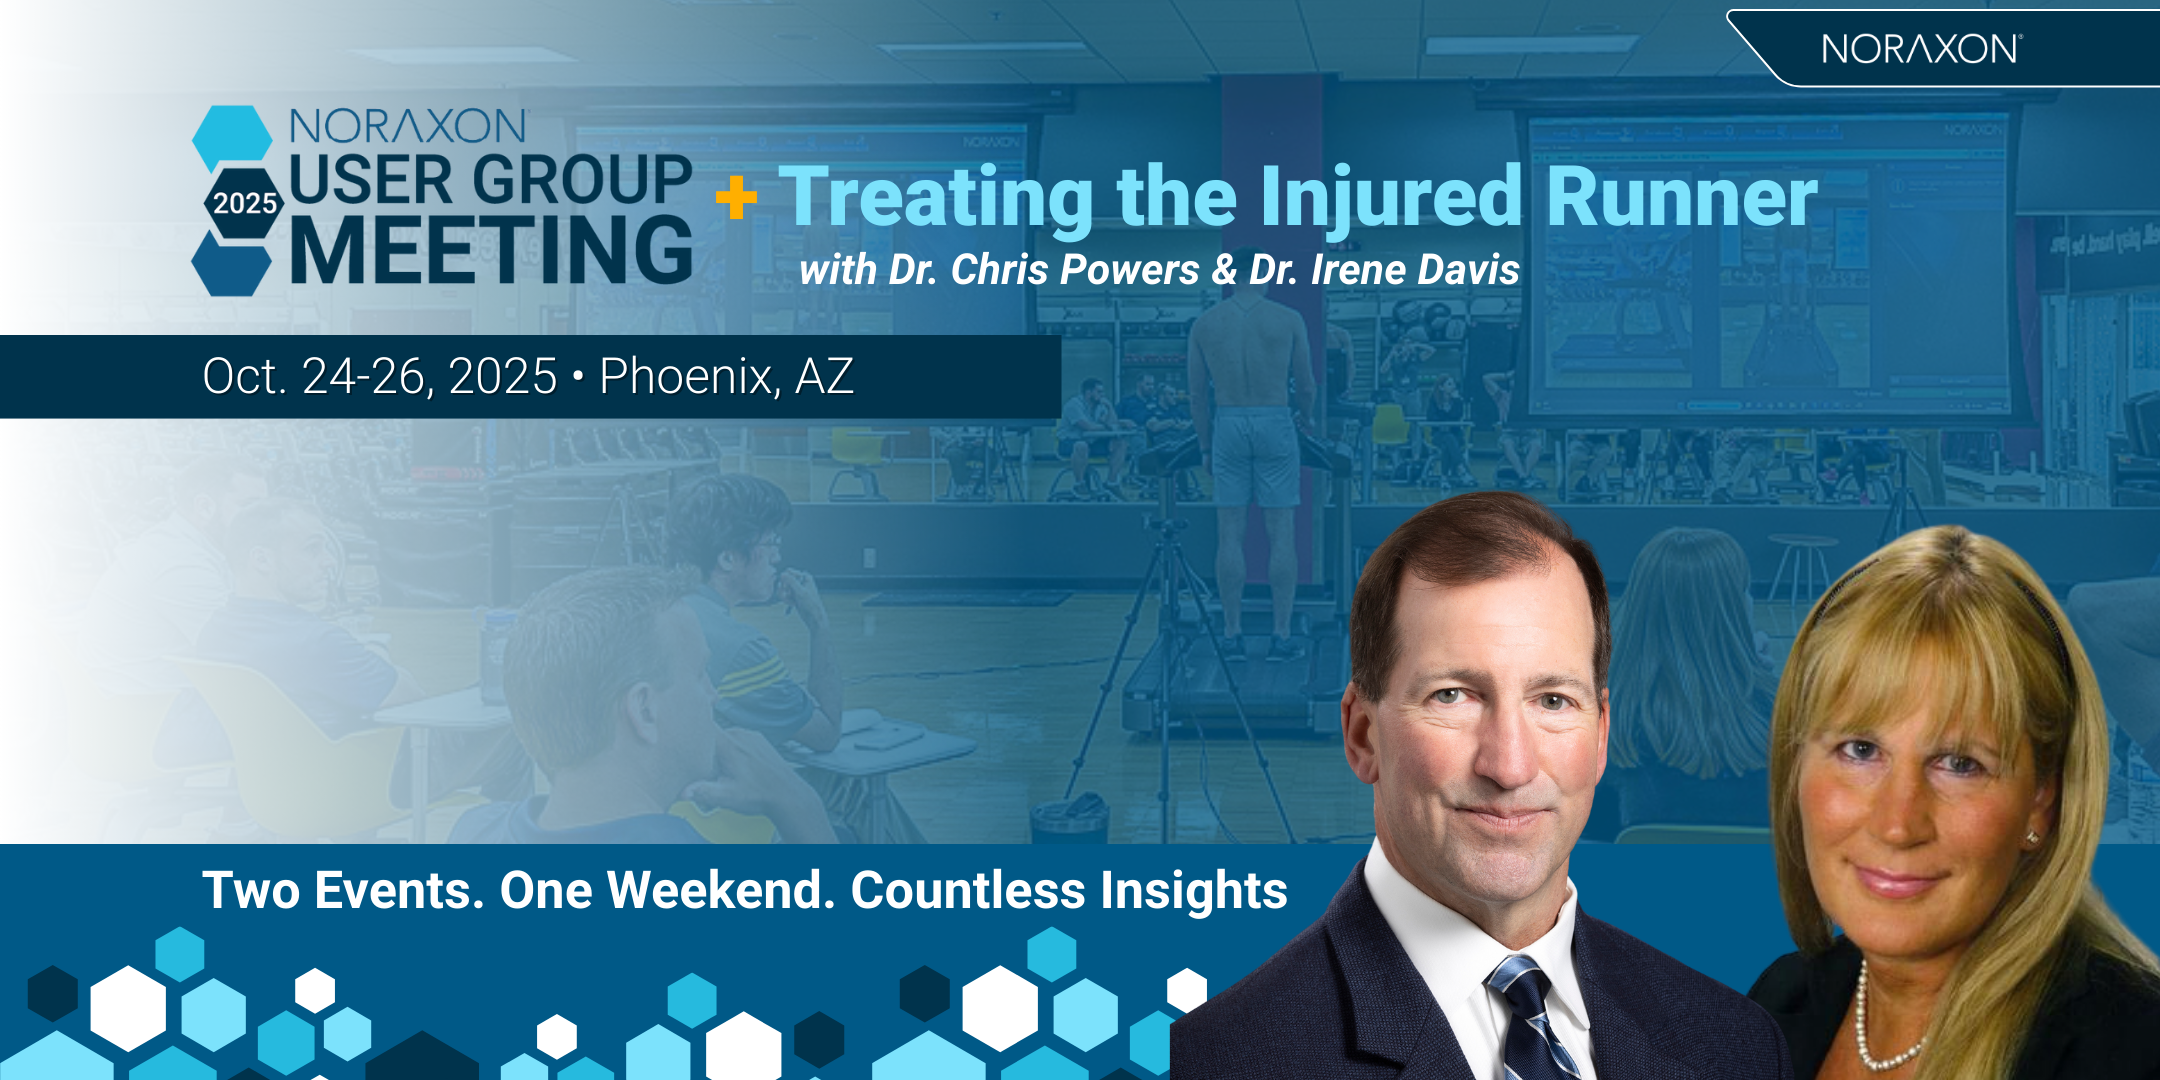
Event Overview Join us for a special dual event
©2025 Noraxon. All Rights Reserved. Privacy Policy | Terms & Conditions | Cookie Policy