Electromyography (EMG) captures valuable data about muscle activity, but the raw signal is noisy, variable, and difficult to interpret without proper processing.
This article outlines the most common EMG processing techniques, explains when and why to apply them, and incorporates practical implementation details from Noraxon’s MR software platform.
Filtering: The First Step
Why Filter?
Filtering is essential for cleaning up raw EMG signals by removing unwanted noise and signal artifacts. Surface EMG is susceptible to both:
- Low-frequency noise such as motion artifacts and DC offset
- High-frequency noise such as ambient electrical interference
A bandpass filter, which combines a high-pass and low-pass filter, is a basic requirement for surface EMG. This filter window isolates the physiological EMG signal—typically found between 20–450 Hz—by:
- Removing low-frequency components (e.g., motion artifact, cable movement, and DC offsets caused by the separation of surface electrodes)
- Eliminating high-frequency interference (e.g., from surrounding electronics or RF noise)
Default Filter Settings by Noraxon EMG System

These default settings ensure signal integrity while preserving the meaningful frequency content of the EMG signal.
For Ultium EMG, it is possible to remove all filters in the Hardware Setup (so that no filters are applied). This feature is available because it is necessary to remove filtering for SmartLead accessories, but is not recommended to be changed as the EMG waveform will tend to wander around the baseline without any high pass filter due to the small DC offset between electrodes. For more details about the digital filters applied in the MR software to Noraxon EMG systems, contact Noraxon Support.
Adjusting Filter Cutoffs
While Noraxon defaults work well for most applications, the high-pass filter cutoff can be raised (e.g., to 30–50 Hz) in high-motion activities to further reduce motion artifact—though this comes at the expense of some low-intensity muscle signal fidelity.
The low-pass filter should generally remain around 400–500 Hz for surface EMG, as this upper bound captures the key spectral content of most surface EMG signals while excluding unnecessary high-frequency noise.
NOTE: If a higher cutoff frequency for the high pass filter is desired, it is recommended to apply that signal processing using the Online Processing operations (for real-time filtering through the Protocol) or the Signal Processing Tools (for post-processing).
To learn more about how to use the Signal Processing Tools in the MR software, watch the video linked below.
High Pass Filtering
Motion artifacts typically exist below 20 Hz, so a high-pass filter is applied to remove them. The choice of cutoff frequency depends on the movement environment:
- Low-motion tasks: 10–20 Hz
- Dynamic tasks (e.g., running, jumping): Can go up to 30–50 Hz
So Why Does This Matter For EMG Analysis?
The answer is simple — motion artifact interferes with onset baseline evaluation and amplitude. Therefore, a high-pass filter may be needed any time motion artifact is noticed. This can be when:
- Recording high-movement activities (e.g. pitching, jumping).
- Using wireless EMG systems with cables or housing attached, as heavier objects attached to the electrode cause more motion artifact.
- Analyzing onset timing, where baseline stability matters.
Tradeoff: A higher cutoff may distort low-intensity muscle signals, so it’s a balance between noise reduction and preserving valid EMG content.
Motion Artifact and High Pass Filter — A Practical Example
Motion artifacts typically exist below 20 Hz, so a high-pass filter is applied to remove them. The choice of cutoff frequency depends on the movement environment:
- Low-motion tasks: 10–20 Hz
- Dynamic tasks (e.g., running, jumping): Can go up to 30–50 Hz
Motion artifacts in EMG are low-frequency noise caused by:
- Electrode or cable placement
- Skin stretching
- Impact or body motion
Artifacts typically overlap with the lower frequency end of the EMG signal (often <20 Hz), especially during dynamics or high-motion tasks.
Tradeoff: A higher cutoff may distort low-intensity muscle signals, so it’s a balance between noise reduction and preserving valid EMG content.
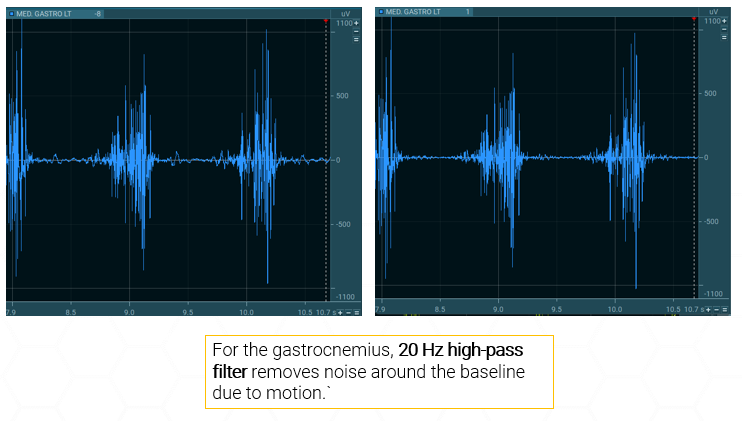
Let’s look at an example showing raw EMG signal. Below is an image of the EMG waveform of the Gastronemius during while walking. Through the digital filters, the high pass filter is set at 10 Hz. In the EMG waveform, there is some “wobble” around the baseline, indicative of motion artifact.

10 Hz high pass filter – motion artifact visible:
20 Hz high pass filter – no motion artifact:
Rectification: Preparing the Signal for Amplitude Analysis
What is Rectification?
Rectification converts the EMG signal to absolute values, so all negative voltages become positive. This simplifies analysis and enables averaging.
- If a signal is not rectified before analyzing the amplitude, positive and negative values would otherwise cancel out.
- In MR, rectification is applied after filtering and before smoothing.
NOTE: Rectification is not needed when RMS (Root Mean Square) smoothing is applied because the RMS algorithm inherently includes the rectification step as part of its mathematical process.
When Rectification Is Needed
Rectification is still required if you’re using:
- Moving average of mean absolute smoothing
- Calculating features like mean amplitude or area under the curve
While it’s important to understand the advantages and purpose of rectification, most clinical applications can simply use the “RMS Smoothing” operation, which accomplishes both smoothing (explained below) and rectification at the same time.
Smoothing: Making Sense of EMG Amplitude
Why Apply Smoothing?
EMG signals are noisy by nature. Smoothing emphasizes the underlying envelope of activation and reduces point-to-point variability.
Common Algorithms
- RMS (Root Mean Square) – Reflects power of the signal over a window; most commonly used.
- Moving Average – Averages the rectified signal across a time window.
- Mean Absolute – Similar to moving average, but includes combined rectification.
NOTE: In MR, a Smoothing window can be applied in milliseconds (ms).
Choosing a Window Size
Smoothing is application-specific:
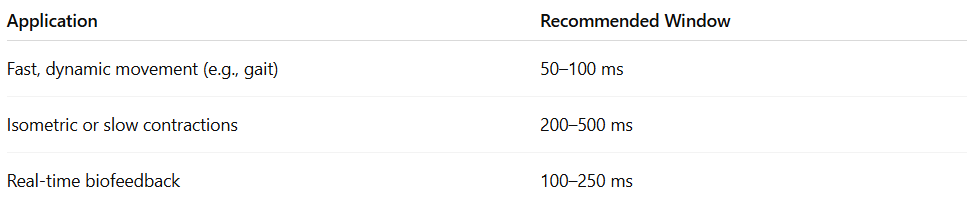
A shorter window retains more timing precision; a longer window provides a cleaner signal but may lag.
Practical Examples for EMG Smoothing Window Choice
Running and Sprinting Analysis (High-Speed, Short-Duration Event)
- Goal: Identify exact onset timing of muscle activation for each phase of running.
- Recommended Window: 25–50 ms RMS
- Why: A shorter window preserves fine temporal detail needed to distinguish precise timing across muscles.
Below is an example of an EMG waveform for the left gastrocnemius during running with 50 ms of smoothing applied. The onset and offset timing is still visible, while still reducing some of the variability and noise.

Now, let’s see what happens if we increase the smoothing window. Below is an example the same muscle and EMG waveform, this time with 300 ms of smoothing applied. The waveform using 50 ms of smoothing overlaid behind it. A clear onset/offset is no longer visible and there is some time shift.

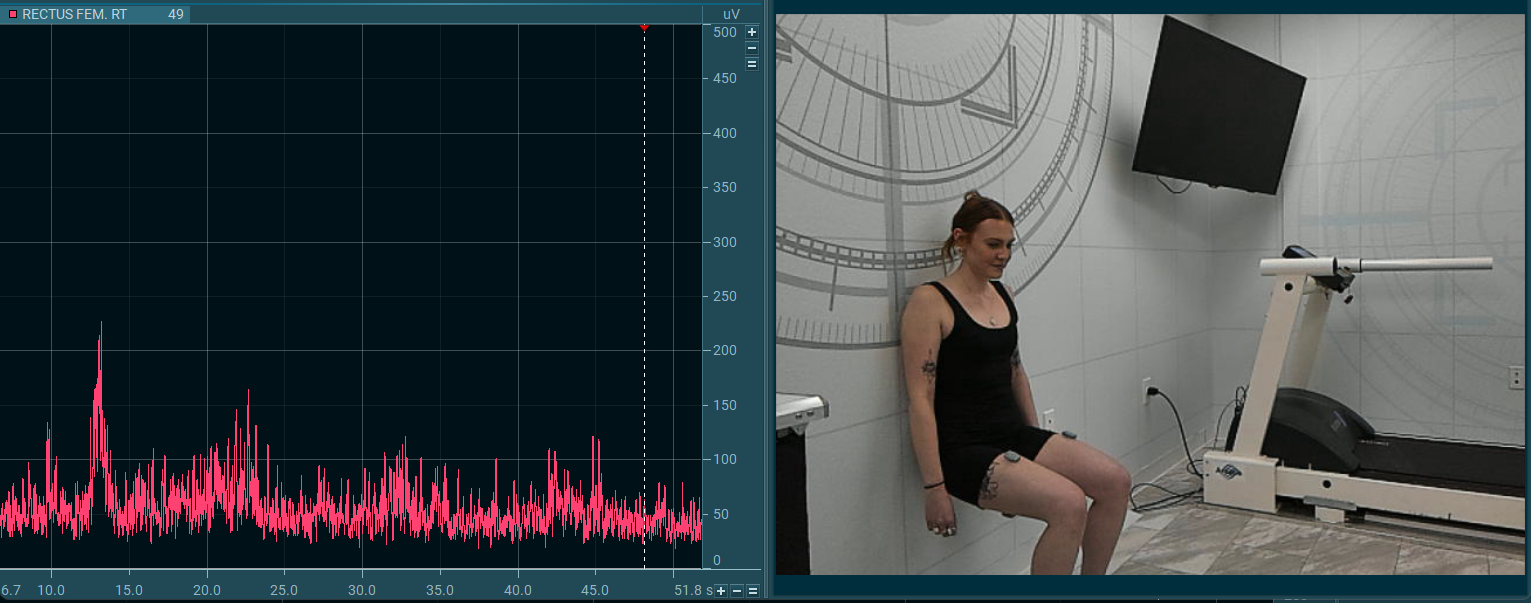
Isometric Strength Testing
- Goal: Quantify peak or average muscle activation during sustained effort
- Recommended Window: 250–500 ms RMS
- Why: Longer window is acceptable since there’s no rapid change; the goal is to average out variability for a clean amplitude measure.
Now, let’s see what happens if we increase the smoothing window. Below is an example the same muscle and EMG waveform, this time with 300 ms of smoothing applied. Most of the variability is now “smoothed” out and an average can be cleanly taken.

In the MR software, it is possible to preview signal processing effects before applying the processing, which can help with deciding the window to choose.
Below are a few more examples of smoothing window choice by activation.
Postural Control or Low-Level Activation Tasks
- Goal: Monitor low-intensity, slow-changing muscle activity (e.g., during balance)
- Recommended Window: 300–500 ms mean absolute or RMS
- Why: These signals are often noisy and low in amplitude—longer smoothing helps clarify the envelope
Real-Time Biofeedback During Rehab
- Goal: Provide users with responsive yet stable feedback on muscle activity
- Recommended Window: 100–200 ms RMS
- Why: Balances responsiveness and visual smoothness; too short leads to flickering of the visual feedback (e.g. rising or horizontal bars), too long adds lag
ECG Reduction (Optional)
Surface EMG recorded near the torso or any main arteries may pick up ECG artifacts, especially from chest or upper back muscles. MR includes an ECG reduction, which requires the user to capture a few seconds of resting EMG baseline before performing any activities. This helps MR identify the baseline ECG waveform so it can be subtracted from the rest of the signal.
This tool is helpful in research involving trunk or shoulder muscles, where the EMG signal is easily contaminated.
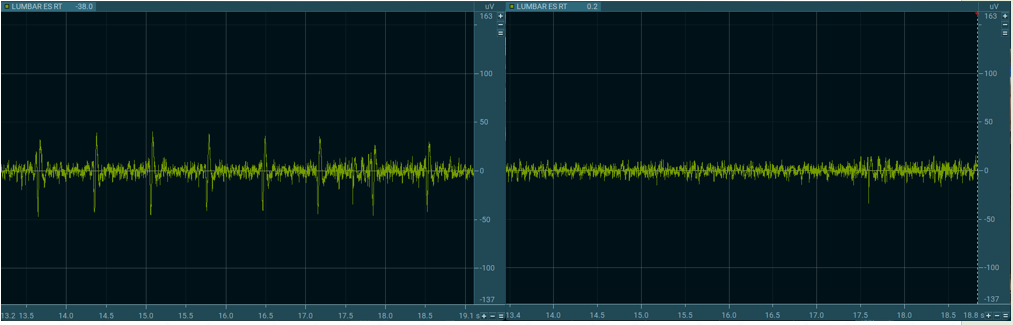
Before ECG Reduction — Signal contains heart rate artifact
After ECG Reduction:
Amplitude Normalization — Making EMG Data Comparable
A major drawback of any EMG analysis is that the amplitude (microvolt scaled) data are strongly influenced by the given detection condition. The amplitude of the EMG signal can vary greatly between
- Electrode sites (which is why careful placement is important)
- Subjects
- Day to day measures of the same muscle site based on subject hydration, amount of hair, quality of skin, etc.
One solution to overcome this “uncertain” characteristic of micro-volt scaled parameters is the normalization to a reference value, e.g. the maximum voluntary contraction (MVC) value of a reference contraction. The basic idea is to “calibrate” the EMG signal in microvolts to a unique calibration unit with physiological relevance — the “percent of maximum innervation capacity” in that particular sense.
Other methods normalize to the internal mean value or a given trial or to the EMG level of a certain submaximal reference activity. The main effect of all normalization methods is that the influence of the given detection condition is eliminated and data are rescaled from microvolt to percent of selected reference value. It is important to understand that amplitude normalization does not change the shape of EMG curves, only their Y-axis scaling.
To summarize, the main benefits of normalization are that it:
- Enables comparison across trials, subjects, and muscles
- Is essential for group studies and long-term monitoring
Normalization to MVC (Maximum Voluntary Contraction)
The most common method is to normalize EMG amplitude to a subject’s MVC:
- Perform 1–3 isometric MVC contractions (3–5 seconds each) for each muscle group. NOTE: In the MR software, only the highest peak is recognized for normalization purposes.
- Calculate the peak or mean value over a defined window (e.g., 500-1000 ms)
- Express future EMG data as a percentage of this reference.
How Do I Implement This in the MR Software?
MR provides both real-time and post-hoc amplitude normalization:
- MVC values are stored in an MVC Stack and automatically applied to later measurements.
- Users can define the reference window and MVC duration for standardization.
For more details on how to apply amplitude normalization in MR, view the video below.
The Practice of EMG Normalization
The MVC test needs to be performed for each investigated muscle separately. The first step is to identify an exercise/position that allows for an effective maximum innervation (not force output).
For extremity muscles, isolated single-joint activities – statically held at middle positions within the range of motion (ROM) – give best results.
For more information about how to chose an MVC test position, reference the ABC of EMG (page 31) 🔗.
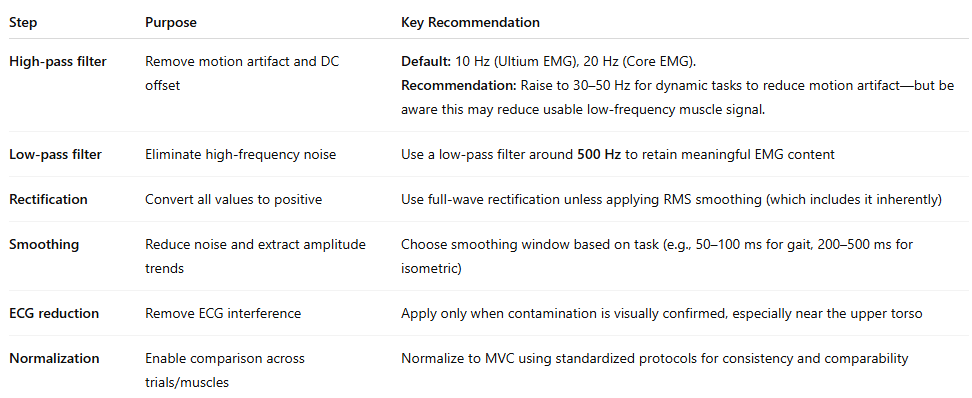
Summary: Best Practices for EMG Signal Processing
The techniques outlined in this article—filtering, rectification, smoothing, ECG reduction, and normalization—form the core of standard EMG signal processing. While these methods address the most common steps needed to prepare EMG data for analysis, this is not a comprehensive guide. For a deeper understanding of EMG theory, signal characteristics, and advanced analysis methods, users are encouraged to reference the ABC of EMG by Dr. Peter Konrad 🔗.
Below is a table summarizing these techniques, their purpose, and key recommendations for reference.